Climate Records
Two of the clearest measurements of a changing climate, from dated snapshots taken October 5, 2026 (nothing is fetched live).
The facts
- Shelf
- Science
- Kind
- Built from a recipe
- Made from
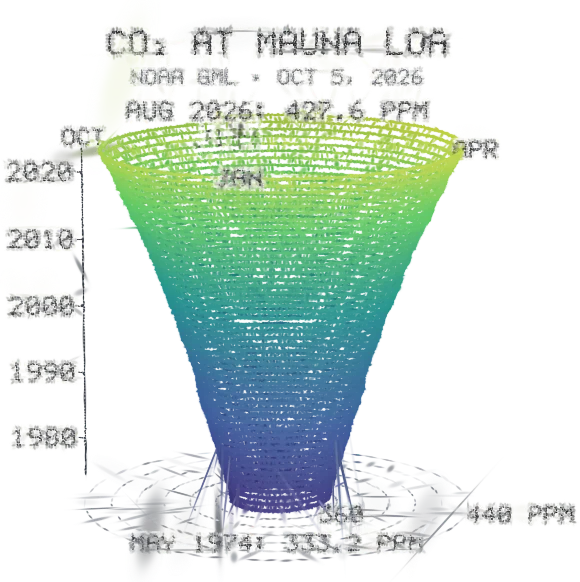
- Monthly mean CO2 in parts per million, May 1974 to August 2026: one turn a year, January in front. The coil leans toward May, when the air holds the most CO2 before northern plants draw it down. NOAA's record starts in March 1958, but its months before May 1974 come from the Scripps Institution of Oceanography, whose terms don't allow reuse here, so they are left out. Source: NOAA Global Monitoring Laboratory, Mauna Loa monthly mean CO2 (file of September 5, 2026); a snapshot taken October 5, 2026, not fetched live.
- Sound
- Yes
- Licenses
- Public domain, MIT
How to play, in the Playground
Pick a record in the Splash tab and turn it; tap to play the record again.
Its controls
| Control | Kind | Range | Start |
|---|---|---|---|
| Play the record | Tap | ||
| Play the record | Button | ||
| Record | List | 3 choices | CO2 at Mauna Loa (spiral) |
About it
Two of the clearest measurements of a changing climate, from dated snapshots taken October 5, 2026 (nothing is fetched live).
The CO2 spiral is NOAA's monthly mean CO2 at Mauna Loa, Hawaii, from May 1974 to August 2026: one turn a year climbing upward, its distance from the middle the CO2 in parts per million. It widens as CO2 rises from 333 to over 427 ppm, faster in later years, and every turn leans toward May, when the air holds the most CO2 before northern plants draw it down. NOAA's record goes back to March 1958, but those early months come from the Scripps Institution of Oceanography, whose terms don't allow reuse here, so they are left out.
The temperature charts are NASA's GISTEMP v4: how much warmer or cooler each month (bars) or each year (a wall) was across the globe than the 1951–1980 average, from 1880. Blue is cooler, red warmer; 2024 averaged 1.29 °C above that baseline.
Is it right?
Climate records draws two published records exactly as their files hold them: NOAA's monthly mean CO2 at Mauna Loa from May 1974 to August 2026, and NASA's GISTEMP v4 global temperature anomalies from January 1880 to August 2026. Both are dated snapshots taken October 5, 2026. The only things left out are the CO2 record's first sixteen years, which come from Scripps and can't be reused here.
Correct
The CO2 spiral starts at 333.19 ppm in May 1974 and ends at 427.55 ppm in August 2026; January 2000 was 369.45 ppm and the highest month, May 2026, 432.34 ppm.1
The splash reads the shipped snapshot of NOAA's file line by line and puts each month on the coil, its distance from the middle set by that month's mean CO2. The tests check the first, last and known months against the values on NOAA's live file, and that the coil's ends sit at those radii.
Correct
The record shown starts in May 1974, not March 1958, because the earlier months are Scripps data whose reuse isn't cleared.12
The snapshot tool keeps only rows from May 1974 on, and a test checks that no earlier month is shipped. The Splash tab and the About text say why.
Correct
Each turn of the coil is pushed out toward May and pulled in toward October: the yearly cycle of CO2 at Mauna Loa, highest in late spring and lowest in early autumn.3
January sits in front and each month has its own direction around the coil, so the seasonal rise and fall in the monthly means makes every turn lean the same way. Nothing is added to the data to show it.
Correct
The temperature charts show GISTEMP v4's global anomalies against the 1951-1980 mean: 1880 averaged -0.18 °C, 2016 +1.01 °C, 2024 +1.29 °C and 2025 +1.19 °C; August 2026 was +1.40 °C.45
The splash reads the shipped snapshot of the GISTEMP table: twelve monthly values per year for the bars and the J-D (January to December) mean for the wall. Months not yet published ('***') are left out, so 2026 has eight bars and no yearly stripe. The tests check these values and that every published month becomes one bar.
- 1Trends in Atmospheric Carbon Dioxide: Mauna Loa CO2 monthly mean data (co2_mm_mlo.csv, file of September 5, 2026), NOAA Global Monitoring Laboratory
- 2Terms of use, UC San Diego
- 3Trends in Atmospheric Carbon Dioxide: Mauna Loa, seasonal cycle, NOAA Global Monitoring Laboratory
- 4GISS Surface Temperature Analysis (GISTEMP v4): Land-Ocean Temperature Index, global means (GLB.Ts+dSST.csv), NASA Goddard Institute for Space Studies
- 5GISS Surface Temperature Analysis (GISTEMP v4), NASA Goddard Institute for Space Studies
- Simplified
- The coil is drawn smoothly between the monthly points (a Catmull-Rom curve), so its shape between two months is drawn, not measured.
- Simplified
- The CO2 coil's height is time, not CO2: CO2 is the distance from the middle, read on the rings on the floor.
- Simplified
- Colors are a guide: the temperature colors saturate at ±1.2 °C, and the bars' heights carry the values.
- Simplified
- December 2022 to early July 2023 were measured at Maunakea, about 21 miles north, while the Mauna Loa observatory was shut by the eruption; NOAA's file says so and the splash shows those months like the rest.
Sources and credits
| Work | By | License |
|---|---|---|
| Trends in Atmospheric Carbon Dioxide: Mauna Loa monthly mean CO2, May 1974 to August 2026 (snapshot of October 5, 2026) | Xin Lan, Pieter Tans and Kirk W. Thoning, NOAA Global Monitoring Laboratory | Public domain (U.S. government work) |
| GISS Surface Temperature Analysis (GISTEMP), version 4, accessed October 5, 2026; Lenssen et al. (2024), JGR Atmospheres | GISTEMP Team, NASA Goddard Institute for Space Studies | Public domain (U.S. government work) |
Libraries
- MIT
- gifenc 1.0.3